Wednesday, January 18, 2023

The agriculture treadmill eliminates both farmers and profit

Despite enormous increase in productivity, farming is in general not profitable and the strategy of international competitiveness that dominates the farm sector in many countries is doomed to lead to ever decreasing profits and ever decreasing number of farmers.

This article draws on the four number-crunching articles posted here the last month and adds some analysis, particularly economic.

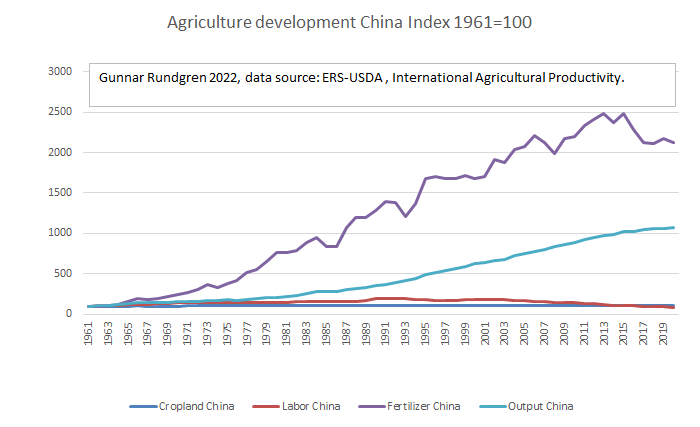
The development of productivity in farming is mind-boggling. 200 years ago the time spent to harvest and thresh one ton of grain was around 30 workdays. The job is now done in five minutes with a modern combine harvester – and John Deere X9 actually can harvest up to 100 ton in one hour if conditions are optimal. Not only has work productivity increased a lot, the yield per area unit has increased as well. As demonstrated here, world agriculture output of crops, measured in tons, has increased with 268% since 1961. The population increased with 151%, i.e. the production per person increased with 43%. This has been accomplished with an increase in cropping area with “just” 20 percent. The work force increased until 2003 when it amounted to 1.06 billion people, but after that it dropped considerably and is now around 0.84 billion.

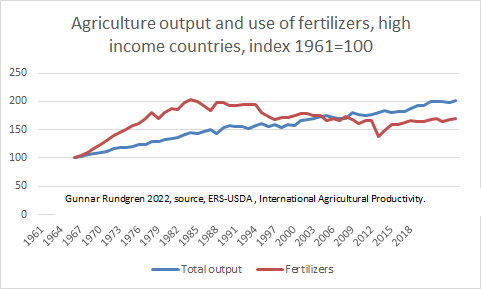
In high income countries, the agriculture work force dropped from 66 million persons 1961 to just 16 million 2020, i.e. three out of four farm jobs have disappeared, most of them being farmers. Meanwhile the output doubled, which means that value per person employed increased 700 percent. Still farming is not a very profitable venture in most countries. There are always some exceptions to this rule either as a result of a specific policy environment or as a result of some individual farmer being superior managers or business people, or just happen to be in a sweet spot at the right time.

Looking a bit closer on Sweden, my home country, we can see that the share of the GDP originating in farming has shrunk from above 6% to just 0.4% in seventy years and that the total contribution to the GDP (i.e. value added in production) has dropped considerably. Value has dropped despite the fact that total output in volume has increased, roughly by 10%. 


Looking at the situation from a farm business perspective, the overall picture shows a remarkable shift around 1990. Until then, Sweden pursued a policy of self-sufficiency through a combination of tariffs and support. That was abolished in the end of the 1980s and was followed by EU membership in 1995. That increased competition a lot and prices dropped. The situation has improved a bit but profitability is still very low as prices of inputs used have also increased. The net farm income corresponds more or less to the subsidies through the EU Common Agriculture Policy.


The development in Sweden and other high-income countries confirms the accuracy of the agricultural treadmill as observed by the American agricultural economist, Willard W. Cochrane.

The agricultural treadmill begins to spin when new technology is developed and implemented by pioneering farmers. These early adopters gain an economic advantage from the new technology, because they can produce at lower costs at unchanged selling prices. As more and more farmers use the new technology, production increases and prices fall, however. The economic advantage gained by early adopters disappears as it is offset by falling prices. This is then repeated again, again and again. The early adopters may be profitable for a while, but they have to continually innovate to remain that. The laggards park their tractors for good and the big majority of farms live on rust and rot (as we say in Swedish meaning they can’t afford to re-invest in their farms, just making ends meet a year at the time).

Ironically it is not even countered by subsidies as they lead to lower prices or higher land prices or any combination of them. For the farm sector as a whole there is actually little point in all that innovation and increase of productivity as it is the buyers and consumers that will reap the benefits and not the farmers as a collective.


Friday, January 13, 2023

Agriculture productivity - Food and agriculture number crunching, part 4

This is the fourth of a series of articles about the developments of the global food system, the first one is here, the second here and the third here. The three previous articles were based on the FAO database. This one is mainly based on the USDA Economic Research Services data on agriculture productivity.

Dramatic growth in output with a dramatic increase in fertilizers


The graph shows the development of some key factors in the global agriculture system. Crop output (measured in value) has increased with 282 percent and livestock output (value) with 243 percent (this can be compared with the output in weight which was 268 percent for crops and 206 percent for livestock products). To produce this the use of machinery increased with 444 percent, fertilizers with 338 percent, capital with 245 percent, irrigated area with134 percent, labor with 28 percent while cropland area increased with 20 percent and pasture area with a mere 2 percent.* The increase in the use of fertilizers has slowed down a bit with a remarkable drop in the end of the 1980s, which has to do with the collapse of the Soviet Union and its satellite states. Fertilizers were subsidized and used indiscriminately. 


As time goes farmers have learnt to use fertilizers more efficiently, but there are limits to how much fertilizer use efficiency can increase. It has reached a plateau in the countries that has used fertilizers for a long time.

Irrigation and fertilizers have clearly increased yields tremendously. Irrigation in arid climates may mean very high increase in productivity as well as multiple annual crops. In the Mekong delta farmers reportedly take three rice crops per year.

In addition to the factors in the graph there are of course others which may increase output, such as the use of pesticides, improved varieties, biological nitrogen fixation, improved crop rotations and general management issues such as a better conversion of feed. As human labor is costly, the huge increase of machinery and capital at the expense of labor is quite logical in a market economy. The use of machinery is, however, more about saving labor than increasing output.


Regional differences

The data above are all global. It becomes a lot more interesting when data is differentiated into groups of countries based on GDP. 


The most remarkable development when it comes to output is in China, where output has increased almost 1000 percent. The output in China was accomplished with a small increase in cropland area and no increased use of labor but with a tremendous increase in the use of fertilizers. This was from a very low level, 2.3 million tons which went to 49.9 million tons. Chinese farmers now use 22% of all fertilizers in the world. Increase in the use of machinery was even higher, although I doubt the accuracy of the data for machinery, especially for China (see more below). 


The deployment of labor is very different in poor countries compared to the rich ones. In high-income countries the labor deployed is only 24 % of the value for 1961 while in low-income countries labor use has increased 3 times. The large middle group shows a pattern where agriculture labor first increased and then started to decrease reflecting an agricultural transition which already occurred 100 years ago or more in the high-income countries. Notably “low-income” countries as a category is defined as per their situation today. Just since 2003, the number of low-income countries has nearly halved, declining from 66 to 31 in 2019 which means that the graph can be somewhat misleading. 


In total some 850 million people are working in agriculture globally of which more than half in lower-middle income countries (e.g. India, Indonesia, Kenya) and just 16 million in high income countries.


We see an even more dramatic picture if we study the value produced per labor unit (in this case a person primarily employed in agriculture). In 1961 output value per employee in agriculture was 10 times higher in high-income countries compared to low-income countries. In 2020 it is 58 times higher. The gross annual income generated by one person in low income countries in average just above US$ 1000, the net income is obviously much lower. The gap has also increased between middle income countries and high-income countries. One really wonder if it possible for low-income countries to develop their agriculture sectors if they are exposed to competition from the other countries. There is certainly a limit to how cheaply one can work. Note that many people in the agriculture sector are “underemployed”, i.e. even if their primary occupation is in farming, they don’t do a full time job there. Others are of course working a lot more than a full time job. My guesstimate, based on my work in low-income countries, is that many people there are subsistence farmers who often seek casual employment here and there.  


Obviously, there is a connection between the use of machinery and the use of labor, where machinery use is very low in low-income countries. The data from USDA ERS doesn’t seem to be sufficiently accurate on a country level to allow for meaningful comparisons though, especially when it comes to China, which according to their data alone commands almost 50% of all agriculture machinery in the world. The use of machinery, according to USDA ERS, corresponds to 35 hp per person employed in high income countries, 3 hp per person in upper middle income and just 0.06 hp per person in low income countries (less than 1/500 of the high income countries). Even if the data is shaky it gives you an idea of the enormous gap between rich and poor countries.


* Explanation of the categories

Output (total)

Gross Value of agricultural output from crops, livestock and aquaculture, $1000 at constant 2015 prices

Output (crop)

Gross value of 162 crop commodities, $1000 at constant 2015 global average farmgate price

Output (animal)

Gross value of 30 animal and insect products, $1000 at constant 2015 global average farmgate price

Cropland

Total cropland (including arable land and land in permanent crops), 1000 hectares

Irrigation

Total area equipped for irrigation, 1000 hectares

Pasture

Total area in permanent pasture, 1000 hectares

Labor

Number of economically active adults (male & female) primarily employed in agriculture, 1000 persons

Capital

Value of net capital stock, $1000 at constant 2015 prices

Machinery

Farm inventories of farm machinery, measured in thousands of metric horsepower (1000 CV) in tractors, combine-threshers, and milking machines

Materials

Index of crop and animal intermediate inputs, 2015=100

Fertilizer

Total N, P2O5, K2O nutrients from inorganic fertilizers and N from organic fertilizers applied to soils, in 1000 metric tons