Coming closer to consumption
(this is the third of a series of articles about the developments of the global food system, the first one is here and the second here)
Almost 3,000 kcal per person per day is made available for consumers, who "need" in the range of 2,100 kcal per person per day. “Made available” should be understood as carried from the shop (if you are a consumer in a market society), brought into the household from your farm (if you are a self-sufficient homesteader, or the raw materials used in a restaurant (if you eat out). Of the difference food waste and metabolic food waste (causing obesity) probably contribute in a similar way (i.e. people waste >400 kcal per day and eat 400 kcal "too much" in average).
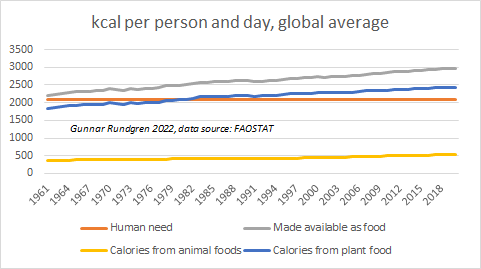
The graph above shows what is made available as food. Now let’s look at the total output of crop production and compare that with what is made available as food. Now we stick only to crops and leave out animal foods. I’ll come back to the animal foods in the end.
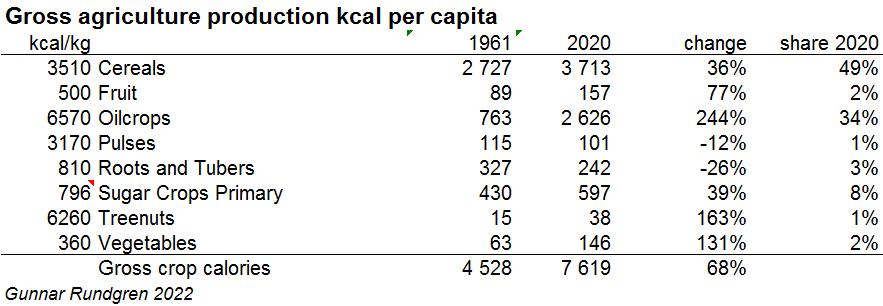
Of the gross output in weight 6% is lost in the production, trade and processing, not including consumer waste, 2% is used as seed, 14% is used directly as feed, 37% is processed into various products such as biofuel, beer, spirits, candy, cosmetics, starch, biodegradable plastics, cotton, vegetable oil and sugar – of which biofuels, vegetable oil and sugar are most important. Much of the leftovers are used as feed (more about that here and here), a lot is used as fuel (e.g. the leftovers from the sugar cane processing) and 41% is used as food.
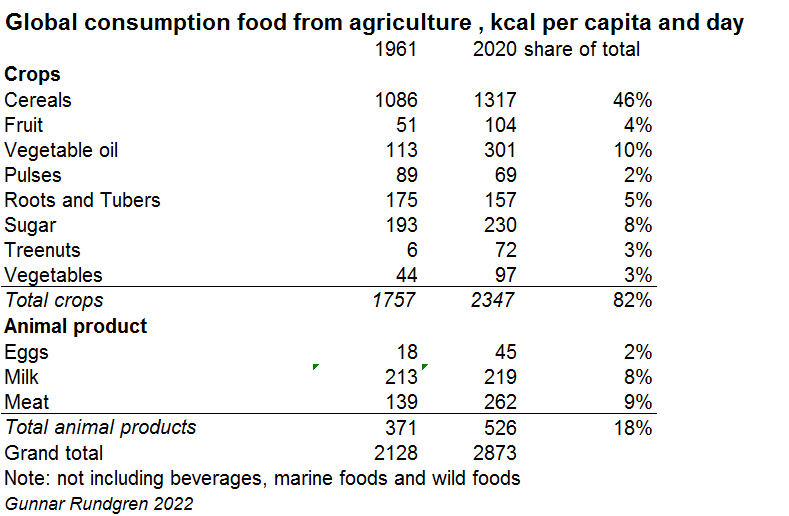
In the end we get a supply of 2,837 kcal per capita from crops (82%) and animal products (18%), not including marine foods and beverages. It is also quite notable that despite all the fuzz about consumption of animal products they contribute around 18% of the calories 2020 compared to 17% 1961. The "enormous increase in meat consumption" is caused by three factors: population growth explains half of the increase, and the increase of food consumption in general one quarter and actual increase in share of meat the last quarter.
In my next article in this series I will discuss how the enormous increase in production has been possible.
No comments:
Post a Comment